 |
| |
|
| |
|
| |
|
| |
|
| |
|
| |
|
| |
|
| |
|
| |
|

|
Arnelos
|
 |
of the Free World
Sep 2002
time: 00:32
|
|
quote:
Originally posted by MrWhereItsAt
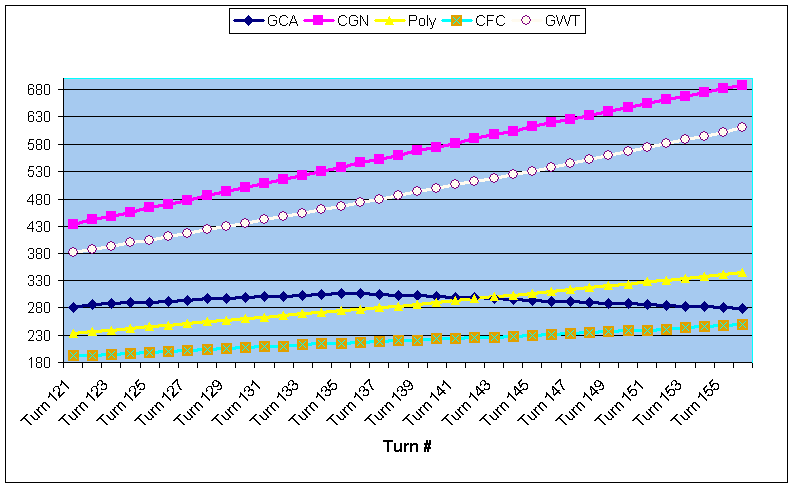
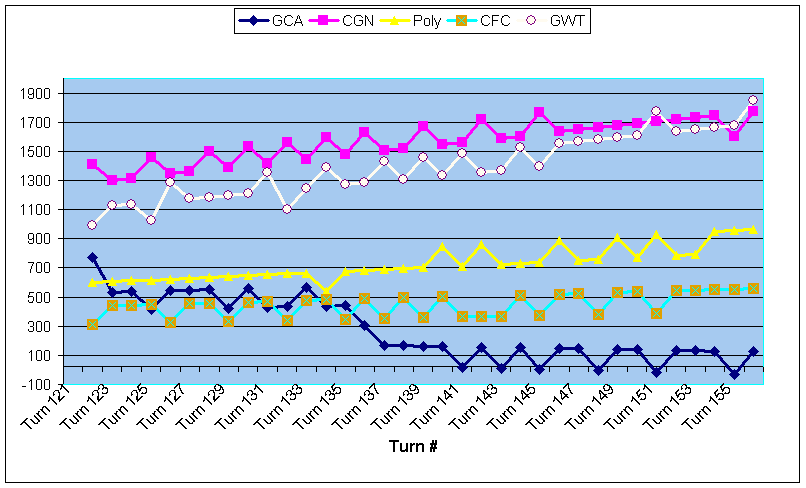
And what about an explanation to that legend? Some of those points have the same x values, and what is all this Poly . (GCA), Poly . (CFC) stuff? |
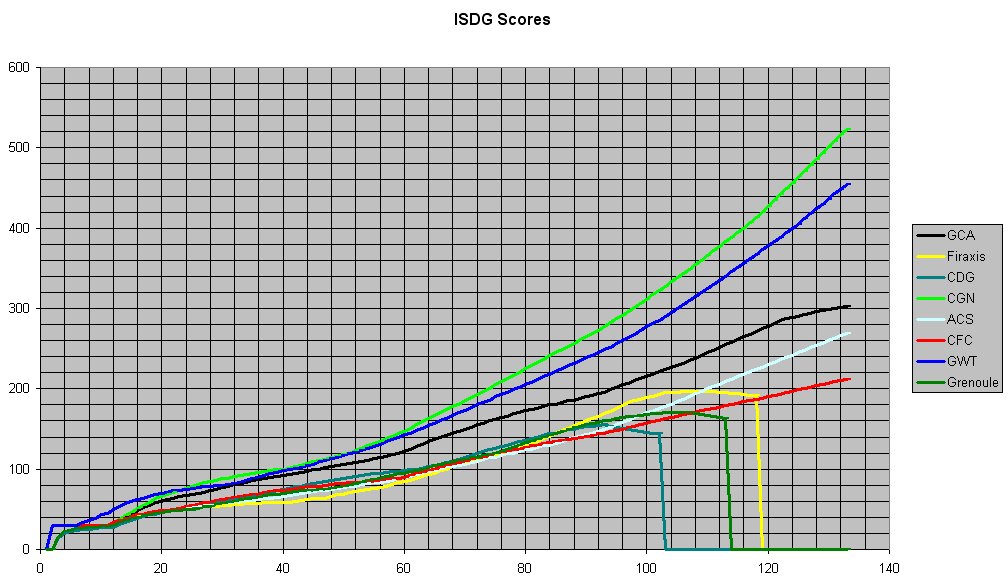
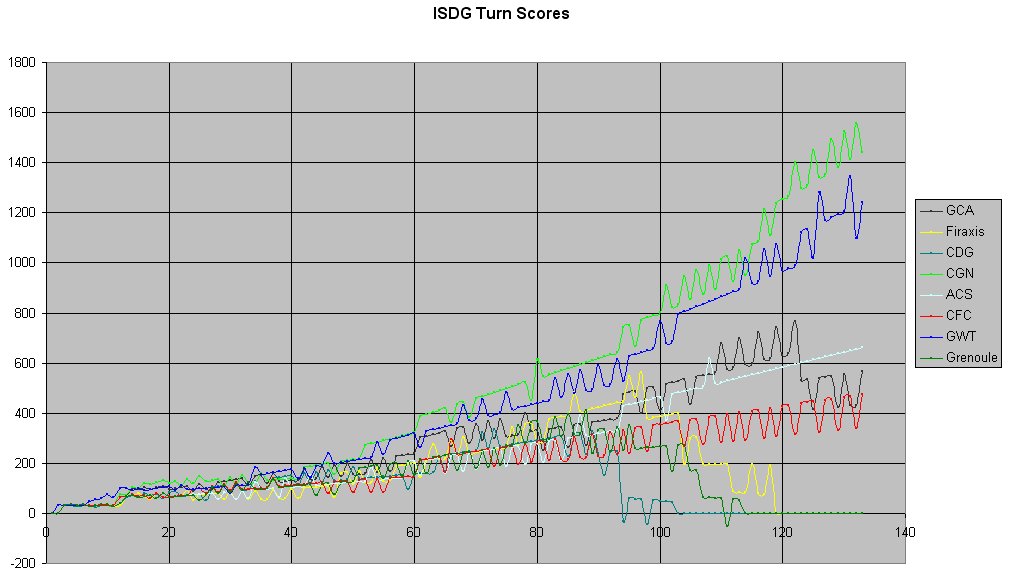
1. As I have stated elsewhere (I think even further up in this thread), the points reflect the estimated REAL score on each individual turn. Since this is, at best, a rough estimate based upon the change in score from the previous turn combined with accumulated scores over time, the points themselves aren't terribly reliable. Also, since the difference between a score going up by 2 points or 3 points from one turn or another is absolutely enormous, the jump in score tends to flucuate if the actual value would cause an increase somewhere between 2 and 3 on average each turn. Again, the individual points don't normally mean very much. What has much more significant meaning are the trends established over time.
2. As such, the lines are polynomial functions created by Excel to approximate the curve of the data points. I used Excel for this and it inserts "Poly. (data set)" as the format in the legend for such functions.
Does that help to explain the issue?
|
|
| |
All times are GMT. The time now is 05:32.
Apolyton Time is 00:32. |
top of page
|
|
|
Forum Rules:
You may not post new threads
You may not post replies
You may not post attachments
You may not edit your posts
|
HTML code is ON
vB code is ON
Smilies are ON
[IMG] code is ON
|
|
|
|
|
|





 22-11-2003 19:12







 You are right on the missing turn #s.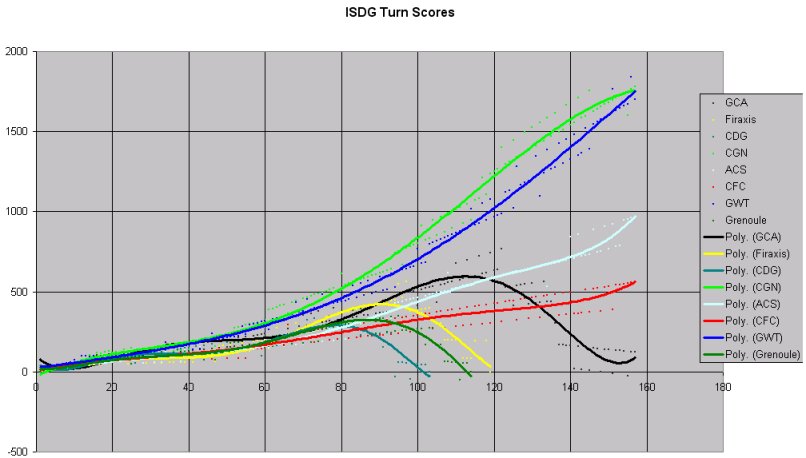











 |
|