|
| |
|

|
DanS
|
 |
Kickball Capital of the World
Jan 1970
time: 00:18
|
|
quote:
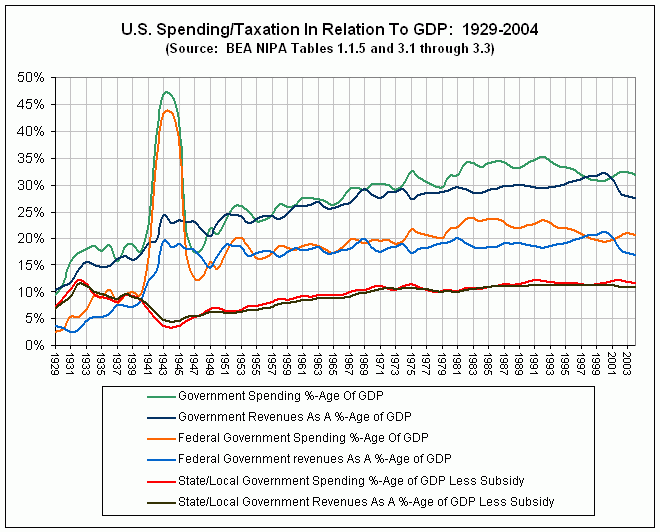
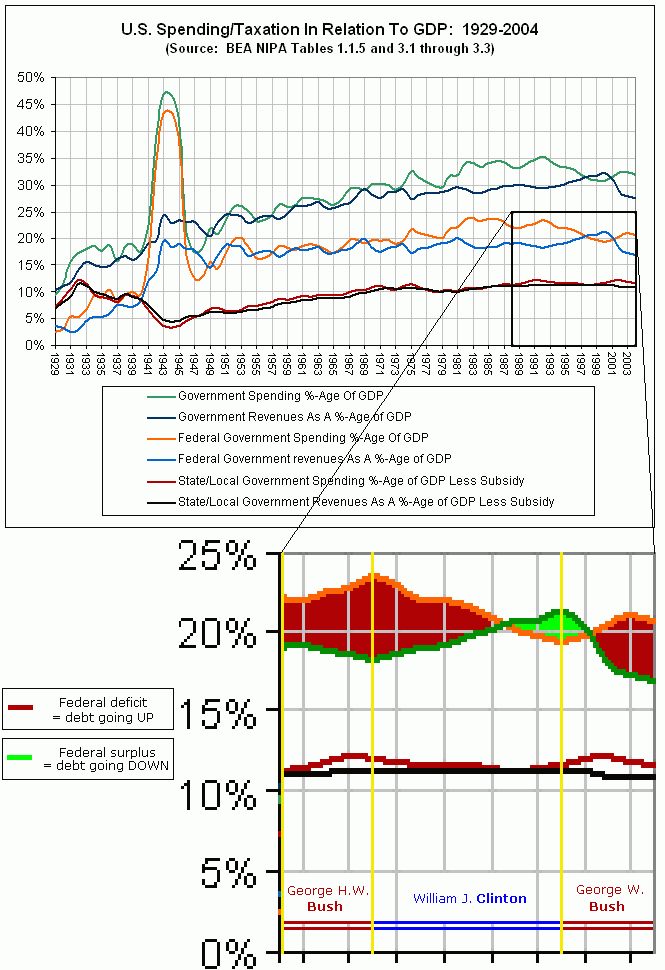
Now then DanS, when you look at the "Clinton" part of that chart, do you see any trend regarding the size of the federal deficit? |
While factually correct, your analysis is misleading. In the US, the previous president's tax and spending policies (inasmuch as they influence the congress's tax and spending policies) are followed through at least the first 9 months of the new president's term. So the spending started heading down at the tail end of Bush 41's policies and up at the tail end of Clinton's policies (all in relation to the economy).
Last edited by DanS on 06-05-2005 at 03:07
|
|
| |
|
|
|
el freako
|
 |
Bristol, European Union
Oct 1999
time: 05:18
|
|
quote:
Originally posted by DanS
No, it doesn't. This one uses total expenditures and revenues. |
So what do you do about the items 'Capital transfer payments' and 'Net purchases of nonproduced assets' (Lines 36 and 37 on table 3.1)
There is no data for them before 1960 - so where did your data for 1929-59 come from then?
quote:
Originally posted by DanS
While factually correct, your analysis is misleading. In the US, the previous president's tax and spending policies (inasmuch as they influence the congress's tax and spending policies) are followed through at least the first 9 months of the new president's term. So the spending started heading down at the tail end of Bush 41's policies and up at the tail end of Clinton's policies (all in relation to the economy). |
 So are you saying that Bush Snr 'saw the light' of fiscal responsibility only during the last few months of his presidency? So are you saying that Bush Snr 'saw the light' of fiscal responsibility only during the last few months of his presidency?
That compares pretty badly with Clinton then doesn't it - he appears to have pursued it up until the end of his presidency (when, remember, there were large surpluses).
You also pooh-pooh Clinton's fiscal repsonsibility by saying about the US's national debt that:
quote:
Originally posted by DanS
It was going up during Clinton too, except his last couple of years. |
Need I remind you that the only years in which the US's net debt has decreased (in the period from 1960-2004 for which comparable data exists) were 2000, 1999, 1998 and 1969 - and the smallest surplus of the clinton years (0.4% of GDP in 1998) was double the only non-clinton surplus of 1969 (0.2%).
And you think i'm being misleading? 
It's a real shame to see you fall from grace like this DanS, I used to have some respect for your analysis and thought you relatively impartial compared to most posters on 'poly.
How the mighty have fallen 
|
|
| |
All times are GMT. The time now is 05:18.
Apolyton Time is 00:18. |
top of page
|
|
|
Forum Rules:
You may not post new threads
You may not post replies
You may not post attachments
You may not edit your posts
|
HTML code is ON
vB code is ON
Smilies are ON
[IMG] code is ON
|
|
|
|
|
|






 05-05-2005 23:40


 Attachment:


 Attachment:





 |
|