|

|
ormuzd
|
|
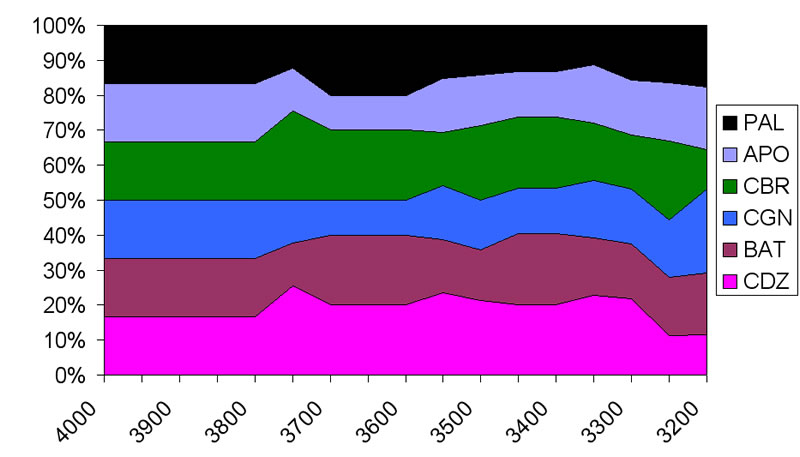
I'm little bit confused about turn 15 (3300 BC)
My calculations showed PAL has increased with 2 pop units last turn but we are still forst in territory.
Any ideas?
|
|
| |
|
|
|
ormuzd
|
|
thank you for the clarification
|
|
| |
|
|
|
ormuzd
|
|
the only good looking graph I could think about
 Attachment: graph 1.jpg Attachment: graph 1.jpg
This has been downloaded 37 time(s).
|
|
| |
|
| |
|
|
|
Arnelos
|
 |
of the Free World
Sep 2002
time: 00:18
|
|
Ok, done my initial analysis with my spreadsheet on the scores and what I call "turn-scores".
Not much to tell w/o cross-referencing with the other data (which I haven't done yet). Here ya go:
* Apolyton and CGN have typical-looking early graphs for civs w/o an early luxury who had their border expansion at the start of turn 11. Boring!
* PAL and CBR each connected a luxury during turn 6 and had their border expand at the start of turn 11.
* CBR must have done something to slightly increase their score on turn 13 that showed up on turn 14. Since I don't entirely remember what all causes score increases (it's been that long), I'm betting the other data you guys have will provide the best clues. Either an increase in the luxury slider or the connection of a second luxury on turn 13 is my best guess.
* BAT connected a luxury during turn 7 and had their border expand at the start of turn 11. There are some other variations in their score I'd want to sim out to check what they arne't just noise that's different from the PAL/CBR noise (produced by the one-turn difference in when the luxury was hooked up).
* CDZ connected a luxury during turn 6 just like PAL and their border expanded at the start of turn 11 just like everyone else. However, something was slightly different about their score on turn 9-10 and they had a significant dip on turn 16-17, neither of which I have easy explanations for. I'd want to sim this out or look at other data to figure out what it is. My best guess, however, is that their starting city is COASTAL, resulting in some expanded border tiles not contributing toward score. Simming this out to determine precisely how many tiles of their initial 8 might be coastal and how many of their added 12 are coastal might be worthwhile.
-----------------
A few questions on my part:
1) How can I post charts of this stuff or the spreadsheet? Is there a way to ensure that that is secure? (should I only send it to E_T?)
2) Who would like to work on refining the score analysis with me to be far more specific about what score indicates.
2a) We need to determine exactly what contributes to score and in exactly what amounts. This should help for determining precisely what permutations in the scores mean; not simply that they exist and we can provide educated guesses.
2b) It would be nice to refine the mathematical analysis. The formula I'm currently using is rather crude and becomes problematic in the latter parts of the game for reading anything other than losses or gains of territory/cities, not luxuries or other minor contributions to score. This is due to the noise. However, it would be possible to refine the expectations of just what the graphs would look like for exact amounts of luxuries/territory/etc. to be able to identify just what a small permutation is at turn 30 that I currently would attribute to noise.
Last edited by Arnelos on 26-08-2005 at 09:13
|
|
| |
|
|
|
E_T
|
 |
Orlando, Florida
Mar 2001
time: 00:18
|
|
quote:
Originally posted by Arnelos
Ok, done my initial analysis with my spreadsheet on the scores and what I call "turn-scores".
[snip]
A few questions on my part:
1) How can I post charts of this stuff or the spreadsheet? Is there a way to ensure that that is secure? (should I only send it to E_T?)
|
post via upload, but, if you want to be fully secure, use a random number, as part of the filename. Example:
12345_uploadfilename.jpg
This will provide enough security, incase someone, like Con, OPD or Trip are trying to mine info (not to say that they would, but just giving examples).
quote:
2) Who would like to work on refining the score analysis with me to be far more specific about what score indicates.
|
rush & ormuzd are running this, so they can help provide direction and get you back up to speed. Also, maybe there is a stats wizard in some of the new GWT crop that is also willig to help....
quote:
2a) We need to determine exactly what contributes to score and in exactly what amounts. This should help for determining precisely what permutations in the scores mean; not simply that they exist and we can provide educated guesses.
|
Please post your efforts (whoever does it) in sim central thread. I want to keep such things togeather, if possible. But links are also good....
This will also help our efforts with building a better sim and info from this can help us to get a better idea as to how to implement that sim.
quote:
2b) It would be nice to refine the mathematical analysis. The formula I'm currently using is rather crude and becomes problematic in the latter parts of the game for reading anything other than losses or gains of territory/cities, not luxuries or other minor contributions to score. This is due to the noise. However, it would be possible to refine the expectations of just what the graphs would look like for exact amounts of luxuries/territory/etc. to be able to identify just what a small permutation is at turn 30 that I currently would attribute to noise. |
one problem with excel, but I wonder if you can port some of the excel date to Mathematica??
|
|
| |
|
|
|
ormuzd
|
|
Arnelos, you might add information to my Free Form post - this is its intention
|
|
| |
|
|
|
Poly-Akryll
|
|
Braunschweig, NDS
May 2005
time: 05:18
|
|
@ Arnelos: I wonder how PAL,CBR,BAT,CBZ could have a connected luxury by turn 6 or 7. Do you look at the scores to see this?
Rush and I have tried to get the correct annual income formular, but we do not have it yet.
But I'm very sure, that while you only have 1 city and a connected luxury the annual income is 2! we have been first up to the current turn, so I doubt that any team has a luxury within their capitalborders as they would probably have it connected by now.
Though Rush and I thought a not-connected city might cause -1 to the annual income. So we are not sure whether anybody has a connected luxury.
Just look at the F11 scores, I think you will agree with Rush and me.
|
|
| |
|
|
|
Arnelos
|
|
of the Free World
Sep 2002
time: 00:18
|
|
As for what I look at, I'm not looking at the raw score data that the game feeds you.
You see, the problem is that the "score" the game feeds you is NOT the actual tabulation of contributing factors to score on that turn. The game actually gives you a score that is an AVERAGE of the contributors to score over time; produced by taking those contributors on every single turn of the game, adding them all together, and just dividing by the number of turns played. When you see the F11 screen, you're not seeing the change in contributors to score over the game, you're seeing the change in their AVERAGE value over the game to that point. This is why a dying civilization will seem to only halt its score increase rather than decrease in score before it finally starts falling (typically only after losing a substantial proportion of its empire).
To get around that problem, I just made a relatively crude spreadsheet that takes those average values, attempts to determine the approximate sums from which they are produced (which is messy because the averages have been ROUNDED to produce the reported scores, producing increasing amounts of noise as the game goes on). The spreadsheet then takes those sums and compares them.... the difference is the aproximate contribution actually made by the contributors to score on the previous turn.
The major problem is that because the reported score is a rounded average, you're only going to notice fractional differences if they show up as intermitant increases in score. It's only easy to notice this extremely early in the game, because later in the game each 1-point difference in reported score can represent as much as several *cities* changing hands on the previous turn and the amount of noise from the delta-score bouncing back and forth each turn simply due to the diminishing returns of previously built cities (which end up producing fractions in the increase to that average) makes it effectively impossible to determine anything less than a major change in another empire.
It would be a lot simpler for me to explain this with visual examples, though... let me see if I can get some of these stupid things uploaded.
|
|
| |
|
|
|
Arnelos
|
|
of the Free World
Sep 2002
time: 00:18
|
|
Here's an example I whipped up:

Now, as you can tell from what I've identified as City #1 being built, there's something of a diminishing returns property to this. When something first happens, only a fraction of its value is typically able to be felt on the first turn simply because Civ3 uses a rounded average that I'm only partially able to parse. While it might take 100-150 turns to reach the limit of the curve produced by a large enough change on turn 80 for the posted score, it should only take a handful of turns here (though still a handful because of the inherent limitations).
This is KEY POINT, however for why (as you observed in your post, Poly) the score for PAL went back down to +2 after being at +3 for only ONE turn! Small changes in the contributors to score will produce a momentary bump in the change to reported score, but will generally fail to register after that (other than as the occassional blip further down the road) because the diminishing returns have closed.
The key to understanding my chart, however, is that I'm attempting to represent the CURRENT total value of an empire with the Y axis. So the bump produced by only a single turn of a single point higher in reported score in the game will hopefully continue to be represented further down the road if its a permanent change.
The problem with the bump provided by connecting an ealy luxury is that the difference is so tiny. The value to score of having a SINGLE happy person (as opposed to a content person) is so small that it hardly registers compared to the influence of building that first city (the diminishing returns from which are still the primary influence on the reported score early in the game). The only way your'e at all likely to notice it is if there's a DIFFERENCE between a non-luxuried civ and a luxury-connected civ - a difference seen in a bump for the graph of the civ that connected its luxury.
Another thing to understand is that because the game reports a rounded average, there is a tendency even when the score stabilizes for the delta-score to bounce back and forth each turn (+1 one turn, +2 the next, etc, etc, etc.). You might surmise that the reason is that the REAL average is somewhere in the ballpark of 1.5 in that example. The exact fractional value (and how it changes over time) is what produces a particular pattern in that bouncing delta-score.
If we assume that we have a luxury that's producing only a SINGLE happy citizen (duh, only 1 city) compared to the far larger influence on score from the city itself, its influence is going to be very very minimal. It's only going to increase that fractional value between two integers slightly. That slight increase is going to mean a slight variation of when and what direction the delta-score changes only infrequently, but it WILL happen.
That's why I'm guessing that Anomaly B could be due simply to the difference in that fraction produced by Anomaly A (the luxury). The difference is so small that the two graphs cross over each other (and presumably would continue to do so w/o other changes) as they wobble along at slightly different frequencies. What PRODUCED the slight difference in frequencies is likely the same thing that produced the bump that is Anomaly A. I believe it to be a luxury being connected.
............................................
Now, I've seen the same pattern before when I've played Civ3 and used these charts. When I've played PBEM games with the other guys from 'poly, I've typically recorded the scores each turn and plugged them into the same spreadsheet, looking for such anomalies and trying to guess at what they are. Over time, I've come to rely on an early bump that's obviously way too small to be a city as being a luxury - in large part due to independent knowledge about it (asking the player and getting it confirmed or later looking at a map of their empire and seeing a luxury very close to the capital city).
I have to offer a caveat, however. It's been so f'ing long since I played Civ3 or used this spreadsheet that I honestly don't remember for sure if this is what the luxury bump is supposed to look like. I think it is, and the timing makes sense (connecting a luxury that quickly would not be unheard of), but it's been a while. It's entirely possible that it's simply something else I'm failing to remember or take into account. I'm open to suggestions.
Last edited by Arnelos on 30-08-2005 at 15:27
|
|
| |
|
|
|
Poly-Akryll
|
|
Braunschweig, NDS
May 2005
time: 05:18
|
|
hmm I could imagine that this is the city growth. We had our city growth a bit later as we built a worker first. And some other team also built a worker first (I just cannot remeber all of these abravations)
And there is Bat that is not agricultural.
Could this be the reason?
|
|
| |
All times are GMT. The time now is 05:18.
Apolyton Time is 00:18. |
top of page
|
|
|
Forum Rules:
You may not post new threads
You may not post replies
You may not post attachments
You may not edit your posts
|
HTML code is ON
vB code is ON
Smilies are ON
[IMG] code is ON
|
|
|
|
|
|





 05-08-2005 18:32


 |
|