|
| |
|

|
alms66
|
|
Louisiana
Oct 1999
time: 23:14
|
|
I still think what is shown on a tile should be a function of a 'View Filter' (Economic View, Political View, Military View, Population View, etc.), with a second filter that works as the 'Map Filter' does, as a qualifier showing a particular variable using color hues.
The current 'Map Filter', "Riots," would then require setting the view filter to 'Population View', and setting the map filter to 'Riots' (I'd use "Rioting Strength" instead, since "Riots" isn't very descriptive, btw).
Further Examples:
code:
View Filter     | Map Filter
Economic View   | Taxes Collected
Economic View   | Production, Food, or Resources Produced
Economic View   | Trade Activity (active trade routes)

Political View  | Diplomatic Relations: (Trustworthiness, etc.)
Political View  | Diplomatic States (Shows diplo states for the selected empire)
Political View  | Active Treaties

Military View   | Power Projection (shows how far and wide, and at what strength power can be projected)
Military View   | Supply

Population View | Riot Potential
Population View | Ethnicity: Group1 (one for each group available - also Religon & Social Classes done the same)
Some of the example Map Filters I have listed above would require 'special case' coding, which would probably put them at the lower end of the priority scale, but many of them are simple queries of a single variable, which makes them much more appealing to code soon. Getting the View Filter on the toolbar, even if it does nothing functionally except change the available map filters based on the selected view filter would be a good thing to do, as it would give a slightly better preview of the overall system than the single Map Filter button and entry we have now.
|
|
| |
|
|
|
LDiCesare
|
|
La Ferté sous Jouarre France
Jan 2001
time: 05:14
|
|
I agree with the map filters.
I have a doubt avout trade routes, though, they are routes, so more of an overlay (if you know the way it was shown in Ctp2).
Politicla views I agree. I just checked a demo of a game (Knights of Honor) which has such a feature, it's very useful. They add icons to show alliances and such treaties/possible treaties, which would also be possible.
Power projection: Yes. I've started coding that which is needed for the ai to "see" that. I'll need some thinking in order to show the overlays better. Currently, the code uses a context obejct to decide what should be shown, and there is a MapAI class that holds the data the ai (or player) sees. I will have to make them collaborate better. This class already has an economic richness handle inside, used by the ai to evaluate if targetting a square is worthwhile. That would allow a filter for "gross economic value" of the square.
Riot potential should be ok to display but again, I should probably dump the figures into the MapAI, which is not currently the case, in order not to recompute them everytime the ilter is switched.
Ethnicity would actually need 2 different kinds of filters:
One to show the distribution of a known ethnicity (thus many filters), the other to show majority ethnicity in every square.
|
|
| |
|
|
|
alms66
|
|
Louisiana
Oct 1999
time: 23:14
|
|
quote:
Originally posted by LDiCesare
Riot potential should be ok to display but again, I should probably dump the figures into the MapAI, which is not currently the case, in order not to recompute them everytime the ilter is switched. |
Since the player has to actively request the information from the map filters, I don't think recomputing every time (each turn, or twice a turn at the most) it's requested is a bad thing. This is not something you'll request every turn most likely, though some people may play with this filter on for the entire game forcing a request every turn.
Taxes, Food/Resources/Production, Ethnicity and riot potential seem like good candidates for implementing. There's the other list somewhere which might offer some possibilities that are just as easy.
|
|
| |
|
|
|
LDiCesare
|
|
La Ferté sous Jouarre France
Jan 2001
time: 05:14
|
|
quote:
I don't think recomputing every time (each turn, or twice a turn at the most) it's requested is a bad thing. |
The real problem is I always compute them at least once. It would just be storing one figure in the map, and the ai, if not the player, may want to check it every turn.
|
|
| |
|
|
|
yellowdaddy
|
 |
Saoir-Ebhor, Sasainn a tuath, Rialtas Aontach
Apr 2003
time: 05:14
|
|
...I'd still like to see a language filter to go with the religion one
{- as they are both constituent parts of "ethnicity", language more so than religion IMO (as discussed at length earlier) because the language is the primary source of the names of each EG, and the primary differentiator, as it's a layer that sits over race and religion.
It may be meaningless to some, but it adds flavour and authenticity IMO, but that's because I'm eager to see a degree of simulation to make the game deeper than all other 4X-style games.}
I know you might say, you'll add it later, but I think if you're planning for this now, it's the best time to put it in.
|
|
| |
|
|
|
alms66
|
|
Louisiana
Oct 1999
time: 23:14
|
|
I believe language and culture in general could play a much greater role in Clash myself. Having a set of values for culture is fine, but there is much more to culture than the few qualities measured currently. I guess you can consider that a vote for languages and expanded cultural modelling in general.
|
|
| |
|
|
|
LDiCesare
|
|
La Ferté sous Jouarre France
Jan 2001
time: 05:14
|
|
Here's an example of an economics filter.
Two things of note:
1) There's a problem with coastal tiles.
2) The importance of population is huge.
The second point is linked to the fact that econ value is based on population.
The first point is due to the fact that the water extends farther from the diamond. I should probably be able to fix it if I filter before the coasts are added to the image.
(Edit - The white parts are due to a problem in the image grabbing/conversion to gif)
 Attachment: filters.gif Attachment: filters.gif
This has been downloaded 50 time(s).
|
|
| |
|
|
|
alms66
|
|
Louisiana
Oct 1999
time: 23:14
|
|
Which Economic filter is this exactly?
|
|
| |
|
|
|
LDiCesare
|
|
La Ferté sous Jouarre France
Jan 2001
time: 05:14
|
|
This is the "economic value" of the square. The one used by the ai to evaluate the worth of a square. It's 20*estimated tax revenue + production tax base.
I will add the tax revenue filter (without the other part) too.
The filter as is shows huge blue squares in highly populated areas.
I also added a filter for possible riots. The filters may need some refreshing from one turn to the next, and the economic value on first turn is not computed, which is also annoying.
|
|
| |
|
|
|
alms66
|
|
Louisiana
Oct 1999
time: 23:14
|
|
OK, given the fact we're computing economic value, shouldn't the tiles with the least economic value be very light, while the others are very dark? I see several which have no color at all, unless my eyes just can't see it in the screenshot. That seems reasonable for water tiles, but I would expect every land tile to have some color, given the filter.
Secondly, why'd you switch to blue?
|
|
| |
|
|
|
alms66
|
|
Louisiana
Oct 1999
time: 23:14
|
|
bump...
|
|
| |
|
|
|
LDiCesare
|
|
La Ferté sous Jouarre France
Jan 2001
time: 05:14
|
|
I picked blue because I wanted somehting positive and red rings as danger to me.
The tiles that have no color in fact have some, but the image shows that, actually, most tiles are quite useless in this map (and in fact most maps): Only the tile with a lot of population generates some economic output. This may mean that the maps are not balanced or that the ecobonlics model puts too much emphasis on population.
As far as color is concerned, I can do a red filter, green or blue easily, a grey to (red/green/blue) easily, or any other colour with more work. Whichever looks better to you is ok for me as I can't really judge that well.
Luminosity shouldn't change on a tile, though I may have made an error in the formula, but blue always looks darker than other colors for some reason. I wish java had better api to handle hue/luminosity instead of RGB, but the color api is mostly horrible to deal with in my opinion.
|
|
| |
|
|
|
alms66
|
|
Louisiana
Oct 1999
time: 23:14
|
|
Well, I'd still really like to see the red to blue scale for the map filters, where red represents high levels (whether good or bad) and blue represents low levels, and a mixture of red and blue (some shade of purple) indicates a middle level. In fact, you could just as easily replace the above red and blue with any colors you like, just so that it's always the same. It's simple enough to become second nature to everyone once you get used to it, and it is consistent, rather than each filter using a different color. Not to mention the fact that you could write the filters quicker because you'd be able to just change what variable you're querying for.
|
|
| |
|
|
|
LDiCesare
|
|
La Ferté sous Jouarre France
Jan 2001
time: 05:14
|
|
The color is just an argument to the constructor, so it's quite easy to change. Blue to red can be done, the opnly problem for me was I equate red with bad (so riots = red).
|
|
| |
|
|
|
LDiCesare
|
|
La Ferté sous Jouarre France
Jan 2001
time: 05:14
|
|
I don't want the units hidden when I change the terrain by an overlay.
I also don't understand what you mean by "it's too busy". Do you care to elaborate? I think my grasp of English is not good enough to understand this simple sentence.
|
|
| |
|
|
|
yellowdaddy
|
|
Saoir-Ebhor, Sasainn a tuath, Rialtas Aontach
Apr 2003
time: 05:14
|
|
"too busy" means there's too much stuff going on - (usually used in terms of colour and/or design).
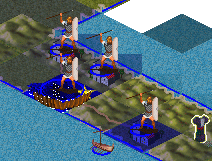
specifically, there's too much: in terms of graphics, happening at the same time: the backgrounds, the fixed units; and overlays like fire etc; the movable units: and their indicators of unit strength; and then you want to put a coloured overlay for economic data on top?! It's just going to confuse rather than inform.
When I look at that screenshot, my first thoughts are - what's the point in all the detail on those units? it doesn't inform me about what they are or what they do, aside from the fact that they're not in any uniform style.
You got a man with a spear standing in a square of blue swamp surrounded by a blue ring and a brown fence with a yellow star in the right - it's a mess. And then what's that funny jacket on the left? is it a unit?
I genuinely believe that simplicity is the way to go with units, overlays, and indicators.
You say you don't want the units (and I imagine terrain too?) hidden when you click on an overlay... Why do you need to know both things at the same time? This is not a realtime game, and in a gamemap that's not that huge, you're fairly likely to be aware of the value of squares without having to see it displayed all the time.
It's common in strategy games over the last 20 years to have a separate map screen with overlays displaying data that is useful to know, but that you don't need displayed at all times - the various Sim games (City, Earth, etc...) to site but a few as well as teh first version of Civilisation.
It's a good short cut to simply do away with the separate map and put the overlay straight on the game map, though it'd be nice too to zoom out to larger scale maps too.
Simple graphics - four (or eight) colour units are all you need, and will improve the whole look of the game, as well as saving memory. The game after all is supposed to be an engine upon which scenarios can be overlayed.
Simpler graphics would also make the screen look tidier, if you insist on the pointless displaying of units at the same time as these map overlays.
|
|
| |
|
|
|
LDiCesare
|
|
La Ferté sous Jouarre France
Jan 2001
time: 05:14
|
|
Displaying units at the same time as, for instance economics information, is useful to make sure your units protect the most economically valuable tiles for instance. So it is not pointless.
I also don't want an overlay to lose the terrain information because I want to always remember which tile among those 20 plains is the isolated mountain.
I don't want the econ value to be displayed all the time, it's just one overlay among others available.
I want to see all the information at a single glance if I choose to. You don't have to activate any overlay at any time. I think the power circle could also be switched on/off based on a setting if you want to, but I'm unsure why one would want not to see the power circle.
Most games I am aware of show at least as much info on the map at any time. Civ showed terrain, specials, units, city or fortifications, roads, mines, railroads at the same time. CTP2 could even add stuff like trade routes.
|
|
| |
|
|
|
yellowdaddy
|
|
Saoir-Ebhor, Sasainn a tuath, Rialtas Aontach
Apr 2003
time: 05:14
|
|
I think there are tidier ways of displaying the info.
the power circle is not the best way. a simple vertical or horizontal line would be clearer and take up less room.
quote:
Most games I am aware of show at least as much info on the map at any time. Civ showed terrain, specials, units, city or fortifications, roads, mines, railroads at the same time. CTP2 could even add stuff like trade routes. |
You're overlaying a colour (for economic info) on top of the terrain as well... i think it's too much - of course it depends on how many kinds of terrain you've got, and what they look like with the overlay.
quote:
Displaying units at the same time as, for instance economics information, is useful to make sure your units protect the most economically valuable tiles for instance. |
I don't think I said displaying them all was pointless; displaying them all at the same time is unnecessary.
and why do you need to see icons of commodities all the time?
surely they should come with the economic overlay
How about a small generic "commodity" icon (like a shield) to show that there's something there, and then when you switch on the economic overlay you get the details?
Mind you, I think that even the humanoid units should just be silhouetted matchstick men...
|
|
| |
|
|
|
yellowdaddy
|
|
Saoir-Ebhor, Sasainn a tuath, Rialtas Aontach
Apr 2003
time: 05:14
|
|
aye, basically the less graphics the better, more is less etc...
it's certainly logical that every polygon should have some kind of resource(s) in some proportions, however, you'd expect to find some areas which were particlarly abundant.
This is economic data, and would aid game speed if this kind of data was restricted to a selectable economic/resource overlay; the player being able to set their own default overlay to suit their preference perhaps.
How many overlays are we talking? 4 or 5?
1. the Bare physical map, then:
Active:
2. "Econo-Resource" (traderoutes, resources, land use),
3. "Politico-Military" (Units and borders);
Passive:
4. Ethnolinguistic (dynastic info; race, language (writing system) dispersal/similarity - "immutable definers"),
5. "Religio-cultural" (religions and ideologies - "mutable definers")
They all overlap to a degree, but provide useful data for decisionmaking: explaning the (likely) behaviour of other "actors" in the game.
|
|
| |
|
| |
All times are GMT. The time now is 05:14.
Apolyton Time is 00:14. |
top of page
|
|
|
Forum Rules:
You may not post new threads
You may not post replies
You may not post attachments
You may not edit your posts
|
HTML code is ON
vB code is ON
Smilies are ON
[IMG] code is ON
|
|
|
|
|
|





 24-01-2005 16:12


 |
|
 |
|